

Chart: Bitcoin: Above $10,000 and turbulent but good
Video: WW2: Waffen SS: We Dreamed of something MARVELLOUS
If all Whites understood what Hitler was trying to do, ALL Whites, everywhere would all have become NAZIS! In this video we take a look at the Belgian Leon Degrelle who became a NAZI and later an officer in the Waffen SS.
[A quick summary of some of the Bitcoin activity. This is a summary from a company that deals in Bitcoin. Jan]
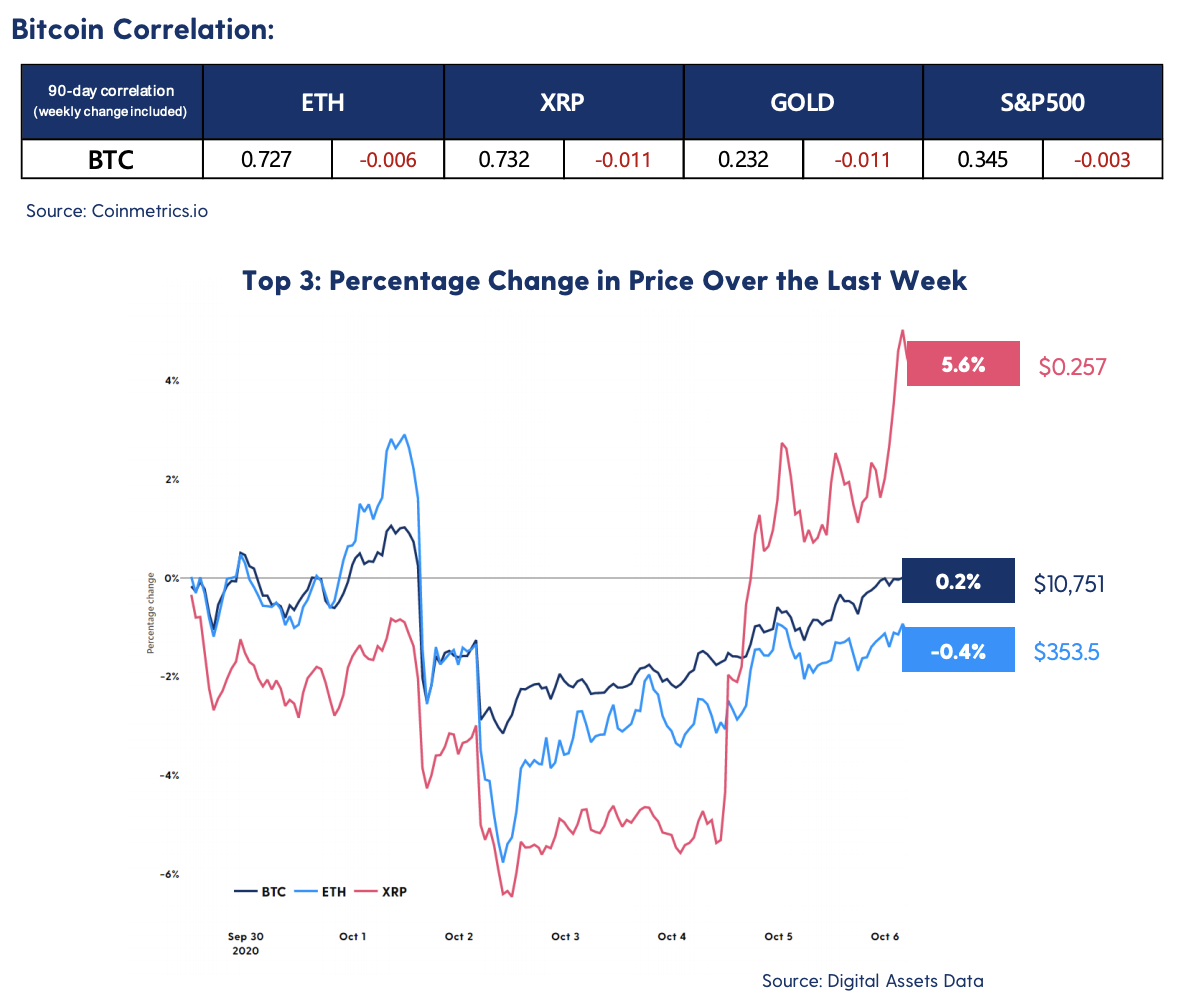
| We’ve now said goodbye to a fourth ‘red candle’ September in a row, with bitcoin’s price having dropped approximately 8% over the course of the month. Despite this, things have actually been relatively stable for bitcoin. We’ve even managed to sustain a new record – bitcoin has now closed above the $10,000 mark for its longest streak of 71 days in a row and counting.
Events this week have certainly tested that streak. First, we saw one of the world’s largest derivatives exchanges, BitMex, charged by the Commodity Futures Trading Commission (CFTC) for failing to prevent money laundering. Then, President Trump and seemingly most of his White House were diagnosed with COVID-19, sending the stock market into free fall – followed closely by the crypto markets. His decision yesterday to call an end to stimulus talks until after the election has also provided further uncertainty for the markets. With a month still to go until election day itself, it’s fair to say that this likely isn’t the last we’ve heard from Trump and Biden. |
|||||||||||||
 |
|||||||||||||
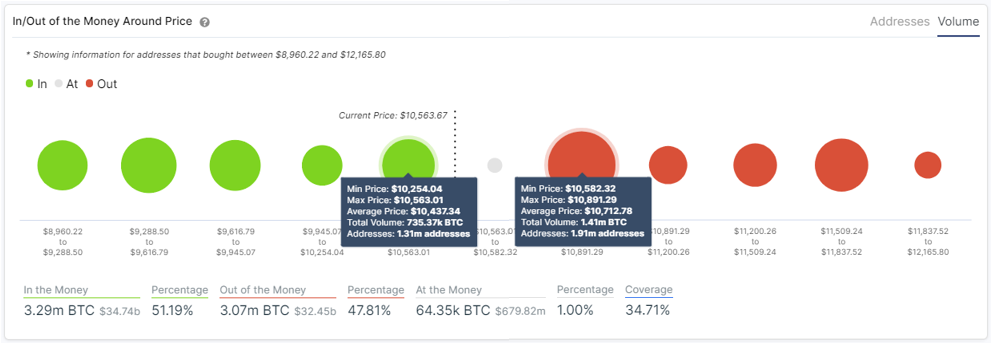
| In this revamped newsletter, we bring you the latest in on-chain cryptocurrency analysis. By analysing on-chain activity, we’re able to obtain a clearer picture of Bitcoin’s current state and what may come next. We look at the blockchain directly and analyse balances, transactions, and the overall activity of market participants. This gives us a unique insight into the future of the market.
These insights are provided in conjunction with IntoTheBlock (ITB). ITB is an intelligence company that leverages machine learning and advanced statistics to extract intelligent signals tailored to crypto-assets. IntoTheBlock tackles one of the hardest problems in crypto: to provide investors with a view of a crypto asset that goes beyond price and volume data. The Luno research team uses IntoTheBlock to dig deeper and get the most important insights about the crypto market.
|


Video: JEWS101: Whites colonised Blacks; Jews colonise Whites! - Introduction to the Jewish problem
This short video is an introduction to the Jewish problem between Whites and Jews.